You publish your jobs in several places at once: on your own site, through the job board network, with ads on social media and via a feed to a client's website. The applications come in — but when it comes to "where did this one come from?", it usually stops at a gut feeling. And without that answer you cannot decide where your next euro should go either.
Analytics is the reporting part of Booston. Every visitor who arrives through a tagged link is recognised; if that person applies, the origin stays attached to the candidate. That way you see not only how many applications you get, but also through which source, which channel and which campaign — down to job and recruiter level. The end goal: being able to see per channel and per campaign what it delivers, so you can shift budget and attention to what works.
After this article you know how the tracking works and what you have to switch on yourself, what is on each of the three dashboards, how the origin ends up in the candidate profile and gets passed on to your ATS, and where to find the cost per channel. You will find the screen via Menu → Analytics.
Before you begin
- The Analytics module is switched on in your environment. Booston enables it at the start.
- Your user role has access to Analytics. Access can be arranged separately per sub-dashboard (Home, Campaigns, Recruitment): see Users: giving access, choosing roles and logging in through your ATS.
- You already have jobs online and at least one active channel — for example Jobboard network, Meta job ads or a Job feed. Without an active channel the campaign dashboards stay empty.
- Your campaigns put UTM codes in their links. How to check that is in How the tracking works: UTM as the common thread.
If you do not see a tab, that sub-dashboard has not been released for your role. If you have no access to Home but you do have access to one of the other two, Analytics automatically opens on the first tab you are allowed to see.
How the tracking works: UTM as the common thread
All reporting in Analytics hangs on one principle: a link to your job carries extra information about where that link came from. That extra information is called a UTM code and sits at the end of the url, after a question mark. Such a link looks like this, for example:
https://careers.example.com/job/1234/mechanic?utm_source=booston.io-Indeed&utm_medium=cpc&utm_campaign=Jobboard+network+TechnicalThe visitor notices nothing, but Booston reads the code and remembers it. There are five fields, of which usually three are filled:
| Field | What it describes | Example value |
|---|---|---|
| utm_source | The concrete source: the job board, the platform or the party the click comes from. | booston.io-Indeed |
| utm_medium | The type of traffic, in other words how it was bought. | cpc, cpm |
| utm_campaign | The campaign this link belongs to. | Jobboard network Technical |
| utm_content | Which variant or which element of the campaign was clicked. | the job title |
| utm_term | Refinement within the campaign, for example an additional job page. | [Additional title] [1234] Mechanic |
What Booston tags automatically
For the channels you switch on inside Booston, you do not have to put anything together yourself. Booston puts the UTM codes in the links for you:
| Channel | What automatically ends up in the link |
|---|---|
| Jobboard network | utm_source with the name of the job board, utm_campaign with the name of your network campaign, plus an internal campaign number. A separate source per job board, so you can compare them against each other. |
| Job feed | utm_source with your Traffic source, utm_medium with your Medium, and utm_campaign with the name of your feed campaign. You switch these three on or off per campaign. |
| Meta job ads | The click-through from the lead form to your job page carries a fixed source, medium and campaign, with the job title in utm_content. |
| Additional job pages | Links to an additional title or location page of the same job carry a utm_term, so you can see which variant produced the click. |
For the Job feed, those three switches are in the campaign itself: Include Utm Source, Include UTM medium and Include Utm Campaign. If they are off, the traffic from that campaign arrives without an origin and does not appear in your campaign reporting. So leave them on — more about this in Your jobs automatically to every job board, platform or partner.
From click to candidate
The recording happens at two moments, and that explains almost everything you see in the figures later on:
- At the click. As soon as someone lands on your site with a
utm_sourcein the url, Booston records that whole set of fields and links it to the visitor. At that moment there is no candidate yet — only a visit with an origin. - At the application. If that same visitor later fills in the application form, the stored origin is attached to the candidate and to that specific application. Only then does the click count as a result in your campaign reporting.
Time may pass between those two moments and the visitor may click through to other pages: the origin stays attached to the visit until an application is made. Visits that never produce an application are cleaned up automatically overnight, so your reporting does not fill up with traffic that delivered nothing.
The three dashboards in short
Analytics consists of three tabs. They answer different questions, so it pays to know which tab you need.
| Tab | Answers the question | Period |
|---|---|---|
| Home | How is my recruitment doing in general, and is everything working technically? | Fixed: the past twelve months. |
| Campaigns | Which channel, which source and which campaign deliver my applicants? | Your own choice, ninety days by default. |
| Recruitment | Which jobs and which recruiters perform best? | Your own choice, ninety days by default. |
Home: where you stand
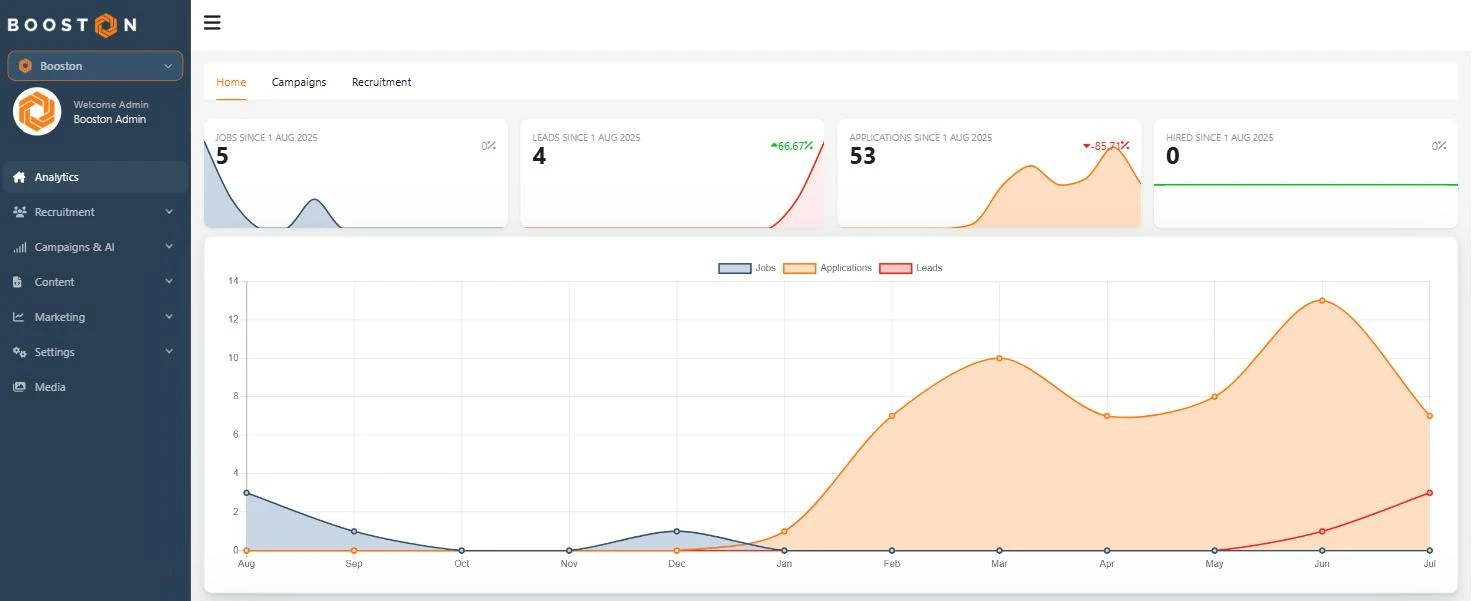
The first tab is your overview screen. It does not look at campaigns but at your recruitment as a whole, over a fixed period of twelve months.
The four counters at the top
Each counter shows a total with the start date of the measurement period underneath, and a small chart with the trend per month.
- Jobs — the number of jobs created in this period.
- Leads — candidates who left their details without a full application, for example through a lead form.
- Applications — full applications.
- Hired — candidates who have been given the Hired status.
The chart
Below that is one line chart with the same three series over twelve months: Jobs, Applications and Leads. Here you see seasonal patterns and the effect of campaigns you switched on months ago. Move your mouse over a point to see the exact numbers for that month.
Activity
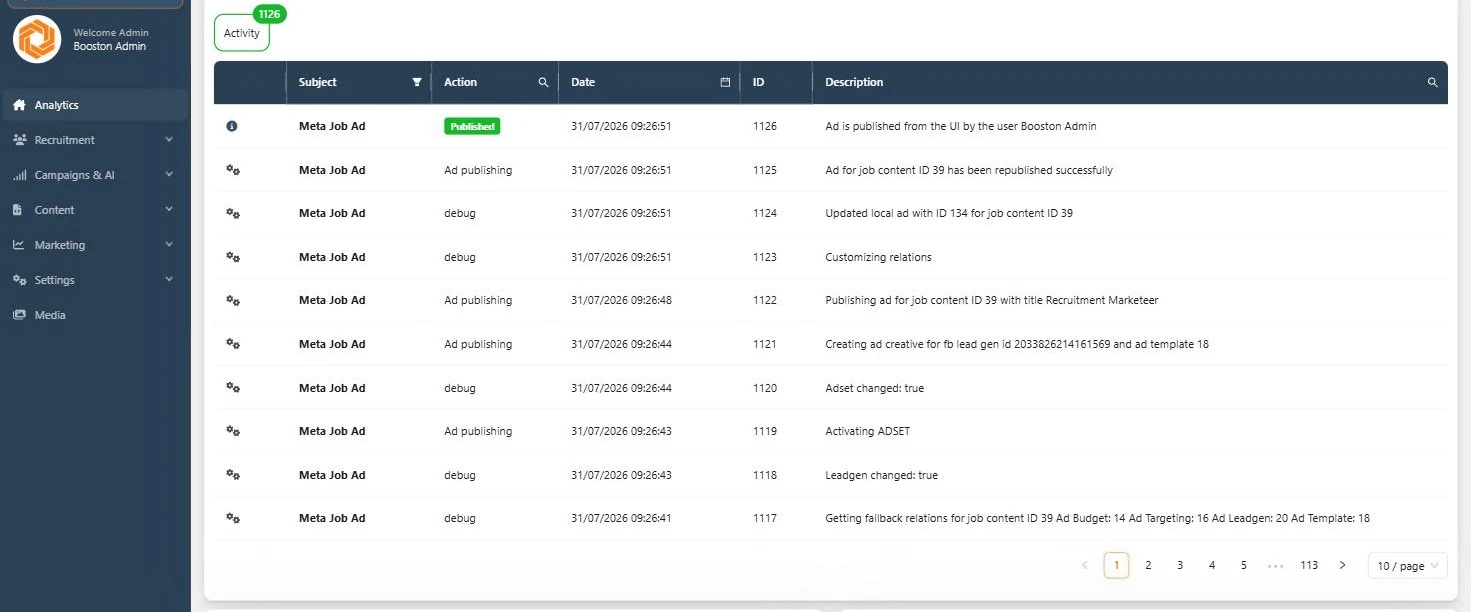
Under the chart is the Activity log: what Booston did or tried to do for you in the background. Especially with ads, this is the place where you see why something is not online.
| Column | What you see |
|---|---|
| (icon) | The type of message: red is an error, yellow a warning, blue is informational. |
| Subject | What the message is about, for example Meta Job Ad. |
| Action | What happened. With ads you see coloured labels here such as Published and Unpublished. |
| Date and ID | When it happened and the sequence number of the message. |
The Description column sits on the right and holds the full text of the message; if it is too long, hover over it to read it in full. You can search in Action and Description, filter on Subject and pick a date range. Active filters are shown as text above the table, with a button to clear them all at once.
Top recruiters and Top jobs
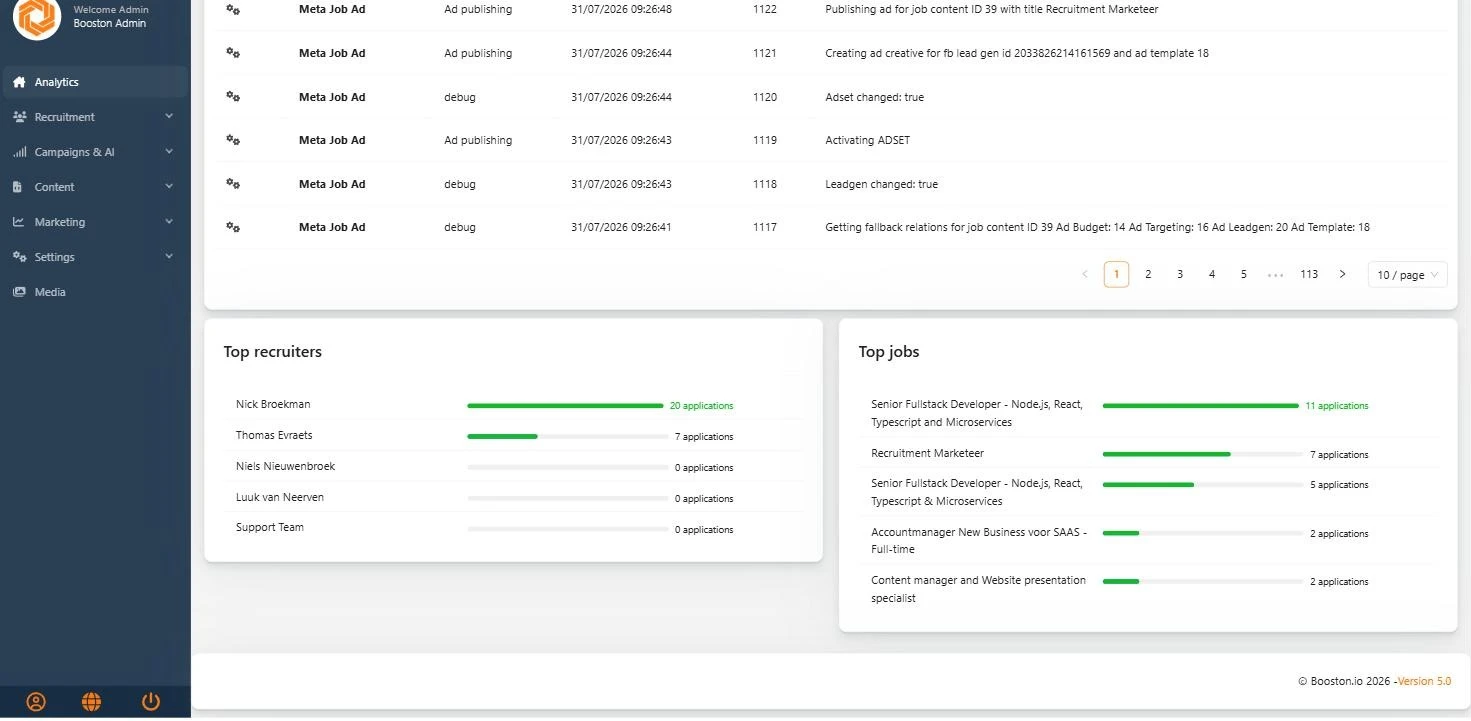
At the bottom are two lists of five: the recruiters with the most applications on their jobs, and the jobs with the most applications. They use the titles in your main language; if you see No default job or No default recruiter, the translation in that language is missing.
Campaigns: which channel delivers what
This is the dashboard where the UTM tracking becomes visible. Here you compare sources, channels and campaigns against each other.
- Go to Menu → Analytics → Campaigns.
- Choose your period at the date picker in the top right. It is set to the last ninety days by default.
- Choose a job in the top left, or leave it on All Jobs. Behind each job is the number of candidates in the chosen period. With Open Application you look at open applications only.
Everything on the page moves with these two choices.
The chart and the counters
The chart shows New campaign candidates: the number of new candidates from campaigns per day in the chosen period. Below it are six counters that lay those same candidates along the stages of your process:
| Counter | What is counted in it |
|---|---|
| Total leads & applications | Everything together: leads, applications, ongoing processes, hires and drop-outs. |
| Campaign Applications and Campaign Leads | Full applications and separate leads, counted separately. |
| Campaign In Progress | Candidates in progress: contacted, appointment scheduled, presented to the team or to the client. |
| Campaign Hires and Campaign Exit | Hires, and candidates who dropped out or withdrew themselves. |
Click a counter to open the matching candidates in Candidates, already filtered on the right stage.
The UTM table
Under the counters sits the core of this dashboard: a table with four tabs, which group the same candidates in different ways.
- Campaign — per campaign. Your starting point: which campaign delivers the most?
- Source — per source. Which job board or which platform delivers the most?
- Medium — per traffic type. Useful for separating paid and unpaid traffic.
- Content — per variant within a campaign.
If you only see the Campaign tab, your role does not have access to the extended campaign reporting.
| Column | What it means |
|---|---|
| Total | All candidates from this source in the chosen period. |
| Applications, Leads, In Progress, Hired, Exit | The same stages as with the counters, now per source. |
| Rating | The average rating of the candidates from this source, in stars. Hover over it: you see how many ratings were given by people and how many by AI. Orange stars mean people have rated too, purple means they are purely AI scores. |
| Details | Opens Candidates, filtered on this source, so you can look at the candidates themselves. |
You can sort on every number column and filter the first column on one or more specific sources. By default the table is sorted on Applications, from high to low.
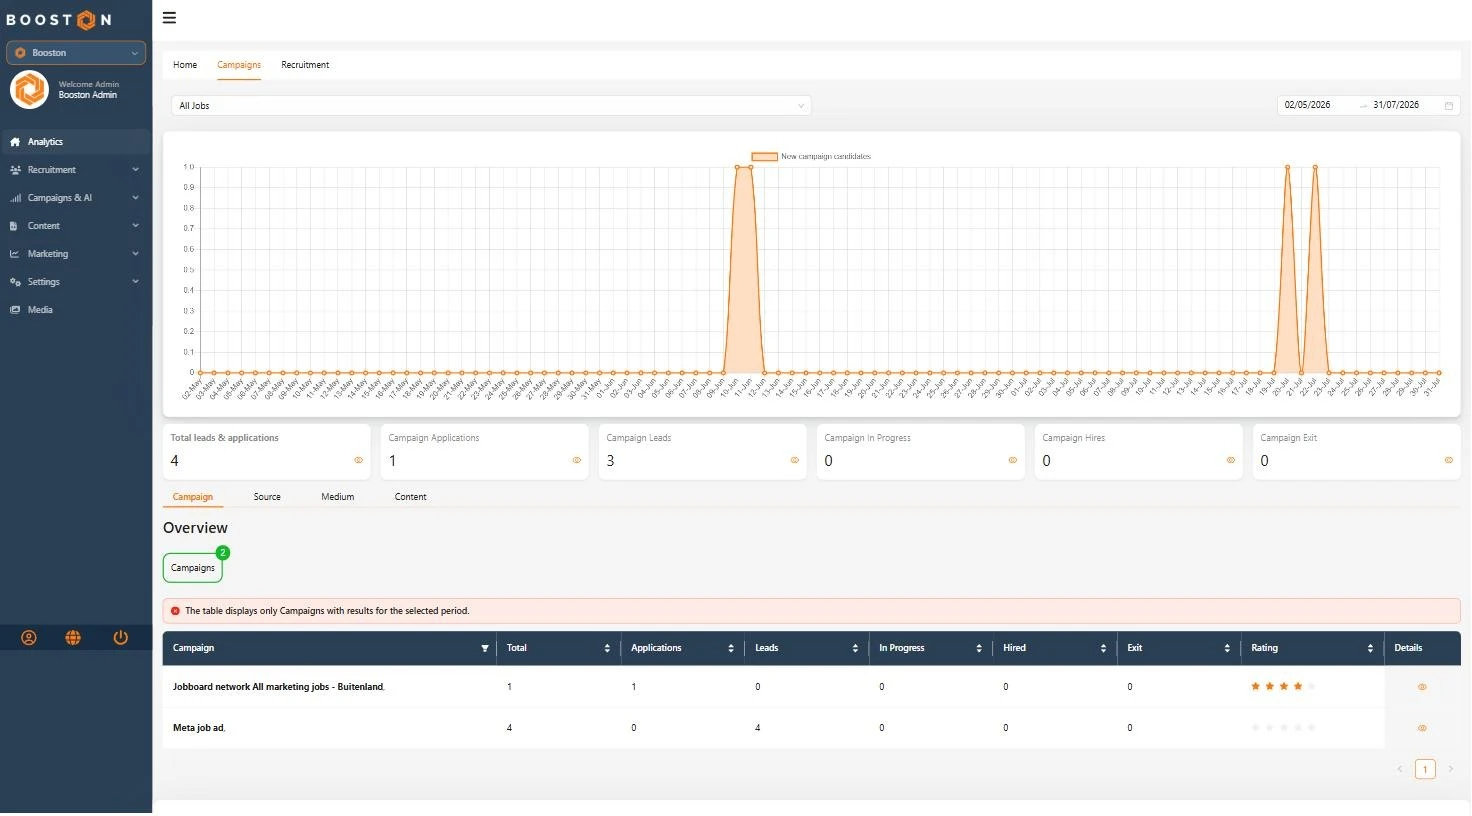
The combination of Rating and Applications is the most useful thing this dashboard gives you. A source that delivers many applications with a low rating mostly costs you time; a source with fewer but better rated candidates is usually worth shifting budget to.
Recruitment: performance per job and per recruiter
The third tab lays the same figures along a different axis: not per channel, but per job and per recruiter.
- Go to Menu → Analytics → Recruitment.
- Choose your period in the top right, the last ninety days by default.
- Choose a campaign in the top left, or leave it empty to see everything.
At the top are the same six counters as under Campaigns, here without the word "Campaign" in front. Below that are two tabs.
Jobs
One row per job, with Status, Main Image, Job, Job ID and the responsible Recruiter, followed by the same stage columns: Total, Applications, Leads, In Progress, Hired, Exit and Rating. Via Details you jump through to the candidates for that job.
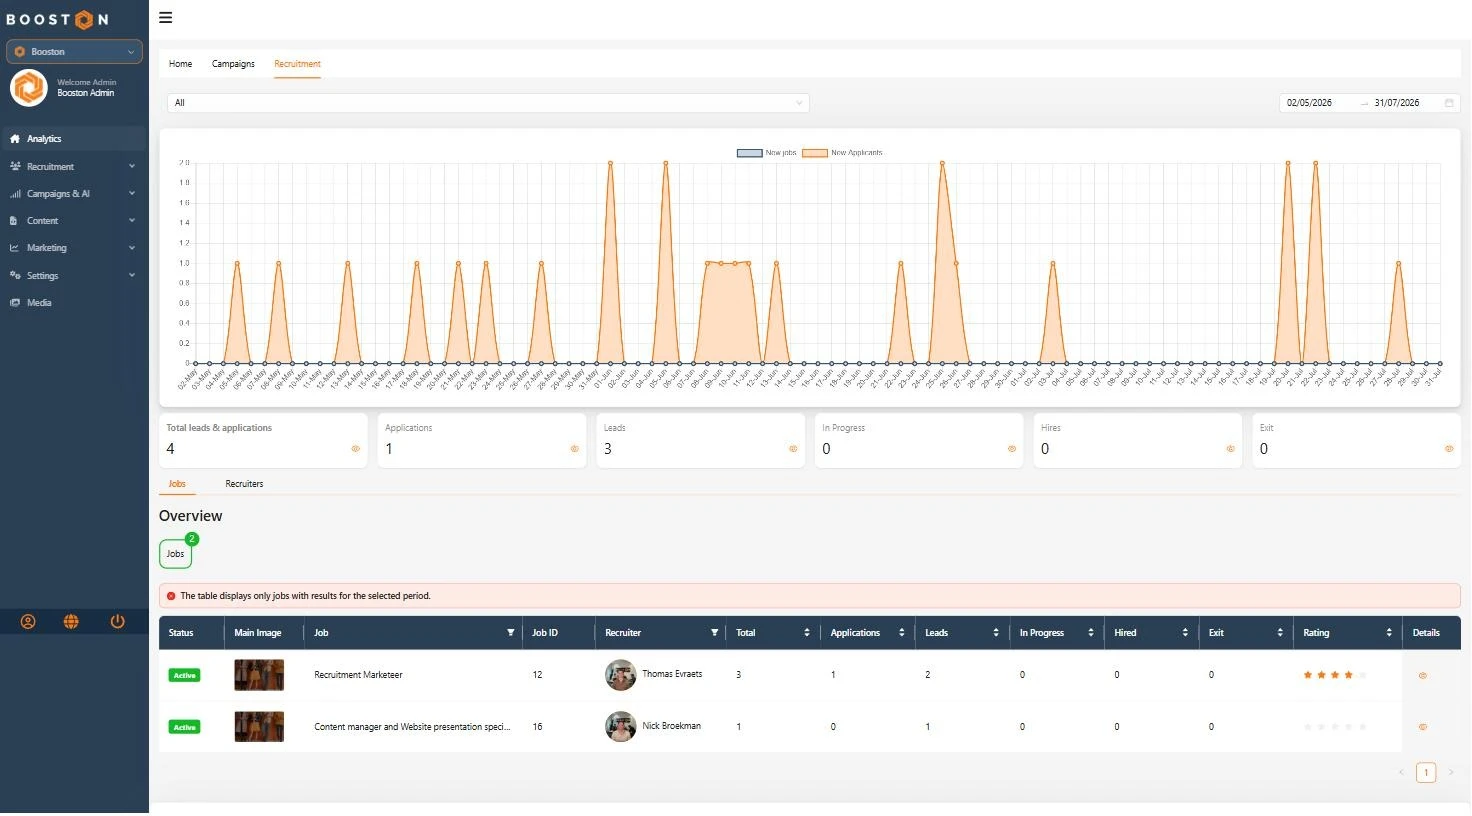
Sort on Total and you immediately see which jobs are doing the work and which are standing still. A job with a lot of reach but zero applications is almost always a text or form problem, not a budget problem.
Recruiters
The same structure, but added up per recruiter: all applications on all jobs that recruiter is attached to. Useful for workload distribution and for the conversation about where attention should go.
Origin in the candidate profile
The origin does not stay in the dashboard — it travels along with the candidate.
What you see in Booston
Under Menu → Candidates there is a Campaign column. It shows the campaign the candidate came in from. If a candidate came in through several campaigns — first through an ad and later through a job board, for example — you see the first campaign with a counter such as +2 behind it; click it for the full list. You can also filter the candidate list on campaign, so you have everyone from one campaign in front of you at once.
All five UTM fields are stored for a candidate, not only the source. If the same person comes back several times through different links, all those visits are kept; when passing data to your ATS, the most recent filled value per field is used.
Passing it on to your ATS
If Booston sends candidates through to your ATS, the origin travels along where possible. What exactly arrives depends on what the ATS itself supports: some systems have fields for all five UTM values, others only know a source field.
| Your ATS | What is sent along |
|---|---|
| Carerix, RecruitNow Cockpit, ForceFlow, Mysolution, OTYS | All five: source, medium, campaign, term and content. |
| Bullhorn | Only the source, in the candidate's source field. If there is no UTM source, the fixed source configured in your connection is used. |
| YellowYard | Only the source, as the candidate's origin. |
| Other connections | No UTM pass-through yet. The origin does remain visible in Booston. |
If you want to know exactly what else goes back and forth, read Connecting your ATS and Booston: which data goes back and forth, or the article about your own connection — for example Connecting Easyflex: fetching jobs and sending applicants back.
Cost per channel: Cost & Performance
Analytics shows what comes in, but not what it cost. Those figures sit with the channel itself, in a separate dashboard per module. That is deliberate: every channel bills differently, so the columns differ.
| Channel | Where to find it | What you see |
|---|---|---|
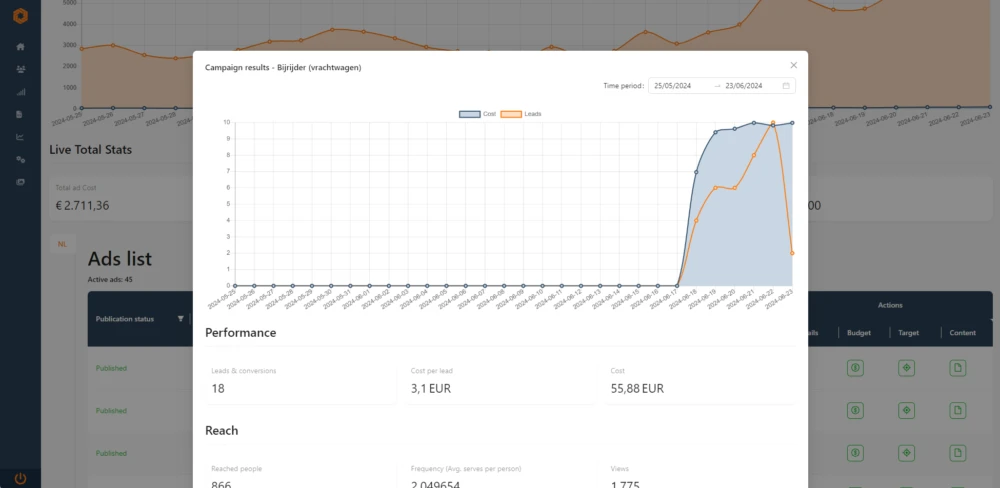
| Meta job ads | Menu → Campaigns → Meta job ads → Cost & Performance | Total ad Cost, Total Leads and Total Reach over the chosen period, with the individual ads and a chart of the trend below it. |
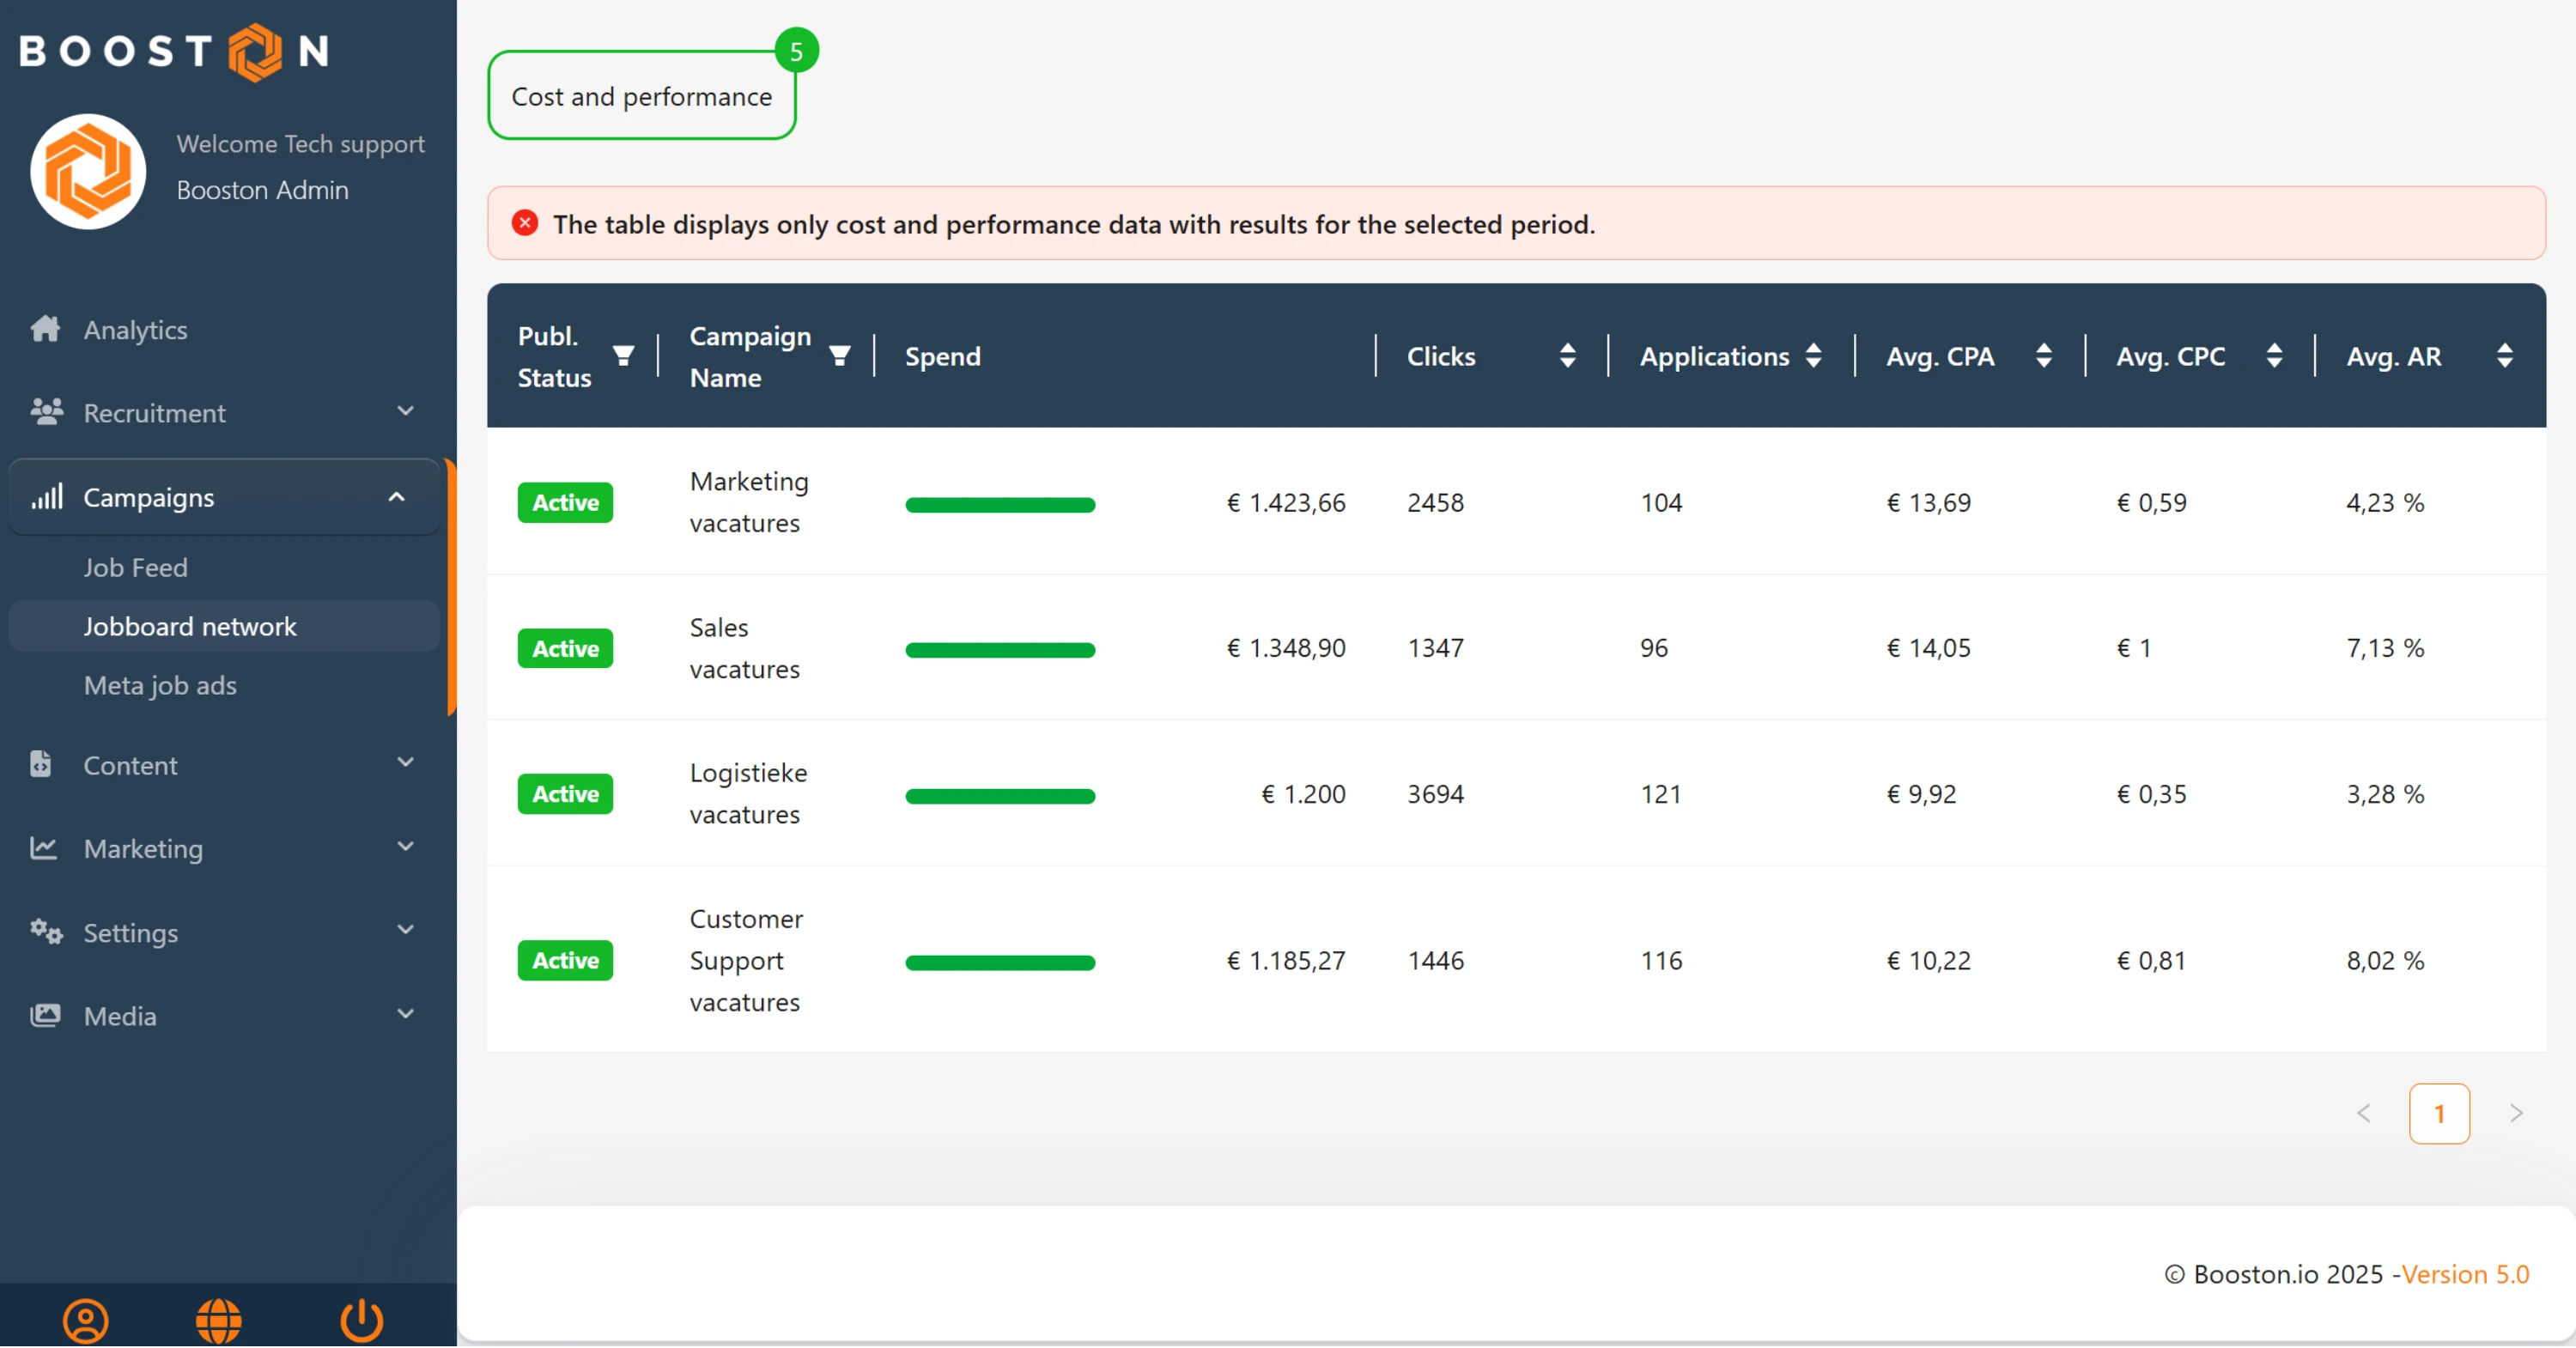
| Jobboard network | Menu → Campaigns → Jobboard network → Cost & Performance | Per campaign and per job: Spend, Clicks, Applications, Avg. CPA, Avg. CPC, Avg. AR and the rating of the candidates. |
| AI | Menu → Campaigns → AI → Cost & Performance | The AI cost per job, broken down per feature: Job Text Generation, Ad Copy Generation, Resume Parsing, Review Score, Video Generation and Candidate Audience Analysis. |
With the Jobboard network, three abbreviations matter. CPC is the average price per click, CPA the average price per application, and AR the apply rate: the share of clicks that leads to an application. A low CPC with a low AR is almost always more expensive than a higher CPC with a good AR — work it through to CPA before you adjust anything.
The AI dashboard opens on the last thirty days by default and counts up to and including yesterday, because today's costs are only complete after the day has closed. At the top are the total costs, the total number of AI actions and the average cost per action. More about switching AI features on and off and setting your monthly budget is in Switching on AI, configuring it and keeping track of your costs.
What you cannot arrange yourself
- Which tabs are visible. Home, Campaigns and Recruitment are released per role. If someone is missing a tab, have your administrator adjust the role; if you cannot work it out, email support@booston.io.
- The setup of the tracking. Which fields are recorded and how they are linked to a candidate is fixed. What you determine yourself is which campaigns send UTM codes along and what you call them.
- The account budget of your channels. The status and monthly budget at account level for Meta job ads and the Jobboard network are read-only. That is a safety measure: one digit too many is expensive. Changes go through support@booston.io.
- The clean-up of unused visit traffic. Visits without an application are cleaned up automatically. This cannot be switched on or off.
Solving problems
The Campaign column is empty for candidates who come from a campaign
The applicant came in through a link without a UTM code. That happens when tracking is off in the campaign, or when the link was stripped somewhere along the way — because someone retyped it or forwarded it without the part after the question mark, for example. For a Job feed campaign, check whether Include Utm Source, Include UTM medium and Include Utm Campaign are on and whether Traffic source is filled in.
The UTM table is empty, while there are applications
First look at the period in the top right and the job choice in the top left: together they can filter everything away. The table also only shows sources that produced a result in that period. Widen the period and set the job back to All Jobs.
Booston shows the origin, my ATS does not
Not every connection supports UTM fields. Check in the table under Passing it on to your ATS whether your ATS is listed. If it is listed and you still see nothing, email support@booston.io with the candidate's name and the date of the application.
My numbers differ from Google Analytics
That is correct and to be expected. Google Analytics counts visits and is blocked by ad blockers and privacy settings; Analytics in Booston counts applications and measures in your own environment. Use Booston for the question "what did it deliver" and Google Analytics for the traffic on your site.
I see rows in Activity that I do not understand
The descriptions are partly technical — they come straight from the advertising platform. If you cannot work it out, send the ID and the date of the row to support@booston.io.
Frequently asked questions
Does direct traffic count as well?
Yes, in the totals on Home and in the counters, but not in the UTM table. Someone who goes to your site directly and applies has no origin and therefore belongs to no source.
What happens if a candidate comes in through two campaigns?
Both visits are stored and you see both of them in the Campaign column. When passing data to your ATS, the most recent filled value per field is used.
Why is the period set to ninety days by default?
Because an application process is rarely finished within a week. Over ninety days you see not only the intake but also what became of it. For a running campaign a shorter period is often more useful; for budget decisions a longer one.
Can I export the figures?
Not from Analytics itself. You can, however, click through via Details to Candidates with the filter already set, and export that list.
How long is the origin kept?
As soon as someone applies, the origin stays with that candidate for as long as the candidate exists in your environment. Visits that never produced an application are cleaned up automatically.
Coming soon
- One way of calculating across all channels. The amounts on the Cost & Performance dashboards of Meta job ads, Jobboard network and AI will be calculated and rounded the same way everywhere, so you can add them up without reservation.
- Spend stays correct when a connection drops out. If the connection with your advertising account expires, the amounts already recorded stay in place instead of the update getting stuck.
- Server-side tracking for Google Analytics 4. You will configure GA4 directly in Booston and the measurement happens on the server side, which means browsers and ad blockers can distort your traffic reporting far less.
As soon as this is live, we will update this article.
Need help?
Cannot work it out, or unsure which setting suits your situation? Email support@booston.io or call 085 0044 215 and mention:
- the name of your environment;
- what you want to achieve;
- the message you see, if there is an error message.
Would you rather walk through the figures together? Book a free thirty-minute online demo — then we will go through it together. Job Done!


